Inside How Can We Thrive?
How a week runs in my sustainability course at SFBU, with slides, prompts and photographs from Fall 2026.
How Can We Thrive? is a course on energy, materials, water, food, climate and cities. Each week takes one chapter of the book I am writing, and each chapter asks one driving question. In Week 2, for example, the question was how a power system built on variable sources can stay stable.
I built every session around something the students do. They play games, run simulations, argue at whiteboards and test their claims against data. The slides on this page are from the decks I use in class. Each deck runs in a browser, with live captions, timers and team scores.
The Shape of a Week
Each student debates the week’s question with Bayley, an AI coach built on that chapter. Bayley asks for a position, pushes back and checks one piece of science.
I receive a class report from those conversations. It never names a student. It shows where the class agrees, where reasoning is thin and which ideas need a second look.
A Think and Do session. Students test claims, read data and work at whiteboards in small teams.
A Discuss and Create session. Students build something from the week: a board, a design or a written entry for the class.
In Week 5, the report read 17 conversations about water. It found four different answers to the week’s question about who should give up water first in a shortage. Seven students had narrowed their position after Bayley pushed back. Thirteen of seventeen named a specific source for their numbers. I opened the next session with that four-way split.
Starting From Home
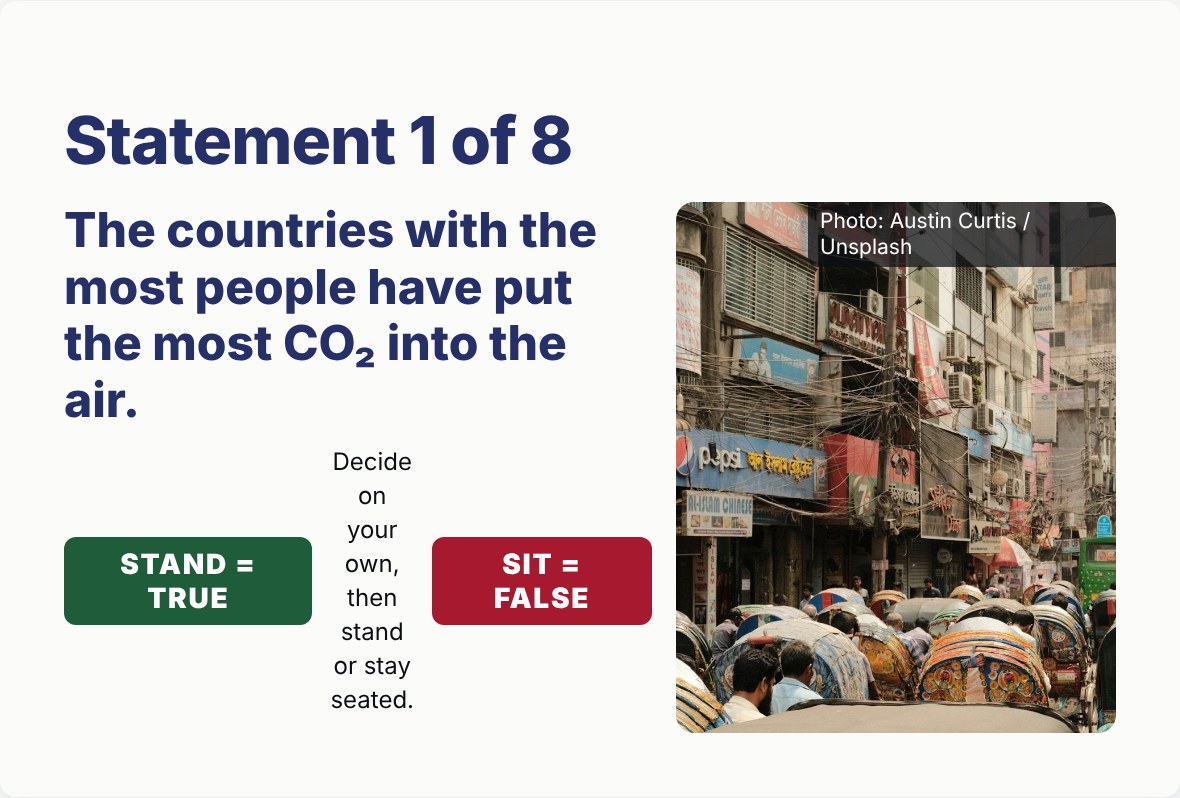
Most of my students grew up in South Asia, Central Asia, Africa or Latin America, and now live in California. Many sessions open with a myths game. Its statements come from the students’ home countries and from the United States. Students stand for true and stay seated for false, and two teams keep score.
Questions With QR Codes
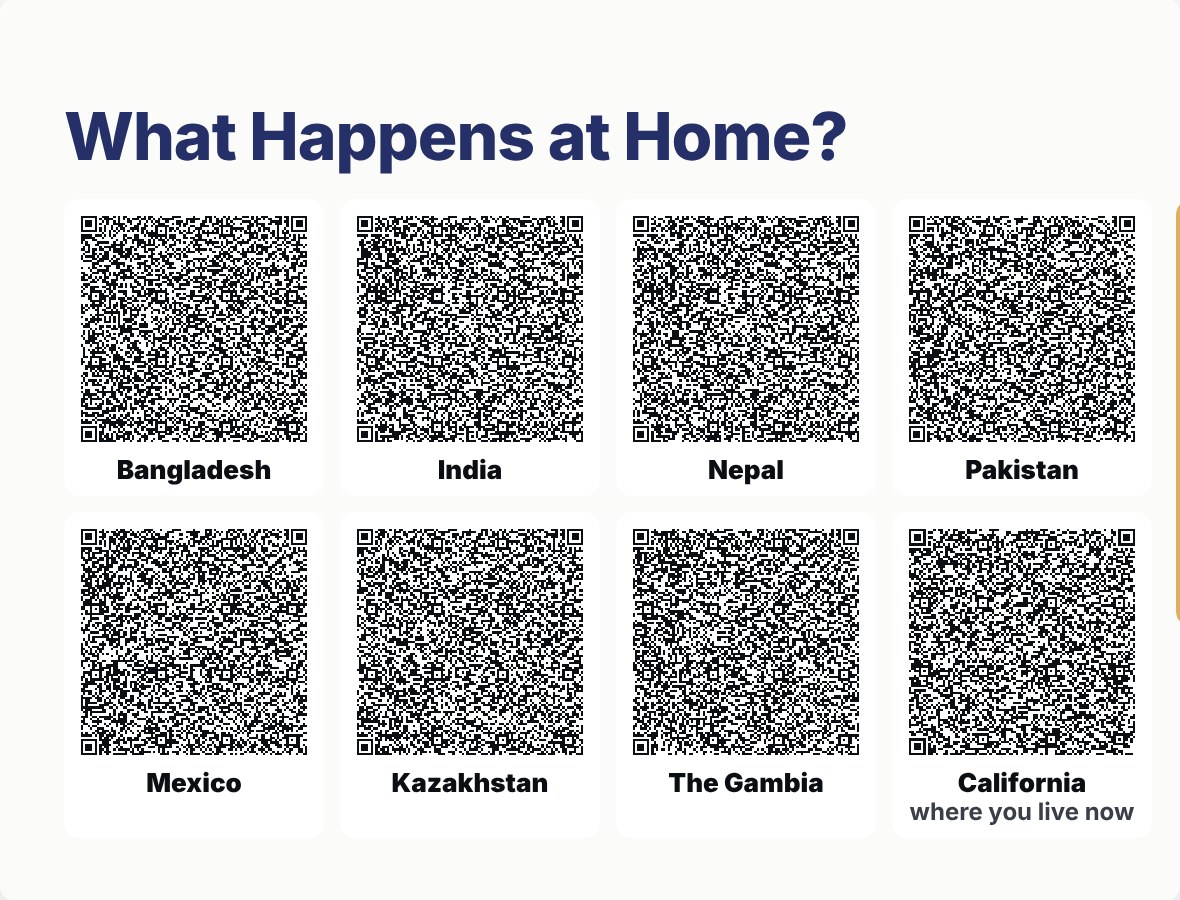
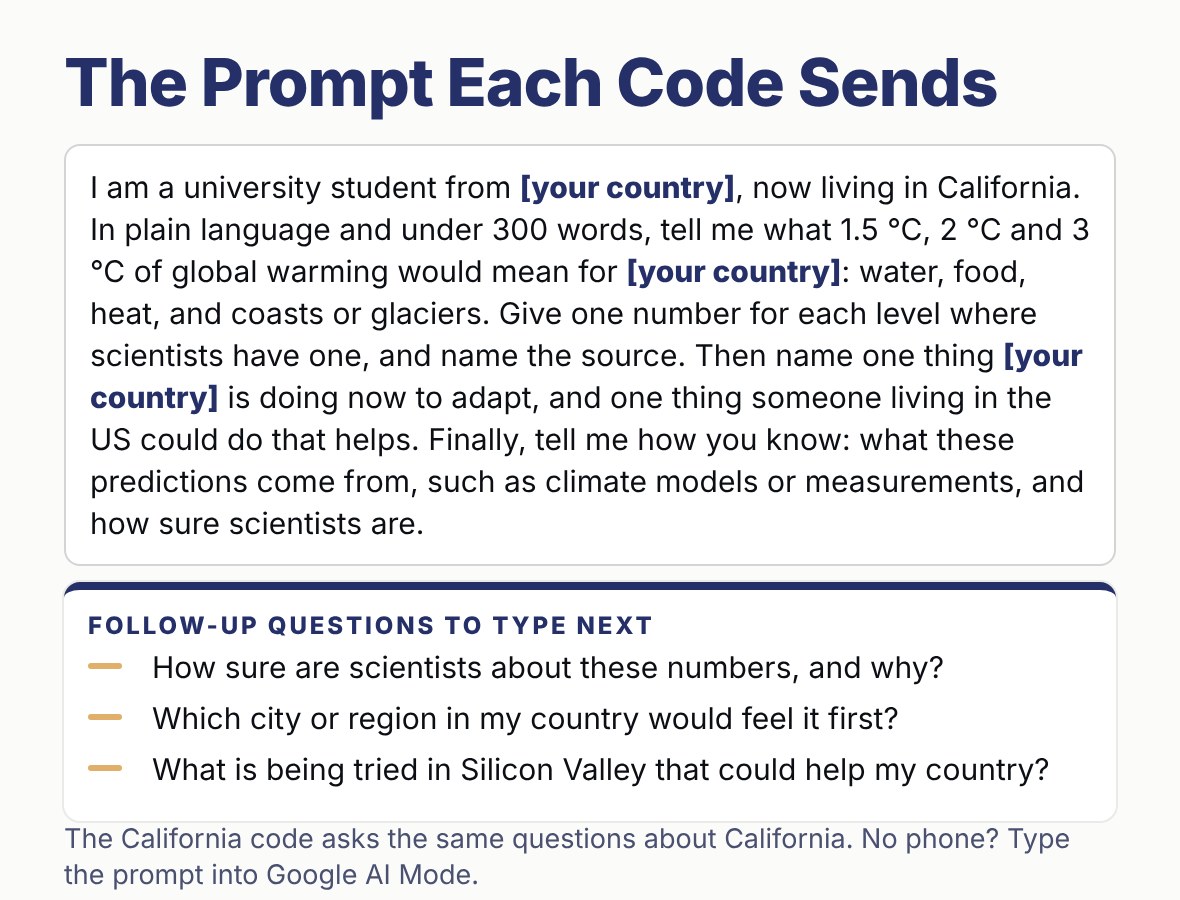
Some slides carry a QR code for each home country in the room. A student scans the code for their country, and Google AI Mode opens with a full question already typed in. Every student starts from the place they know best, and the class then compares what they found.
The questions are written to make students check the answer. Each asks for numbers with their sources, and ends by asking how the AI knows and how sure the sources are.
Try Three of the Codes
These three codes are the ones students scanned in class. Scan one with a phone, or select it to open the question in Google AI Mode.
Keep the Lights On
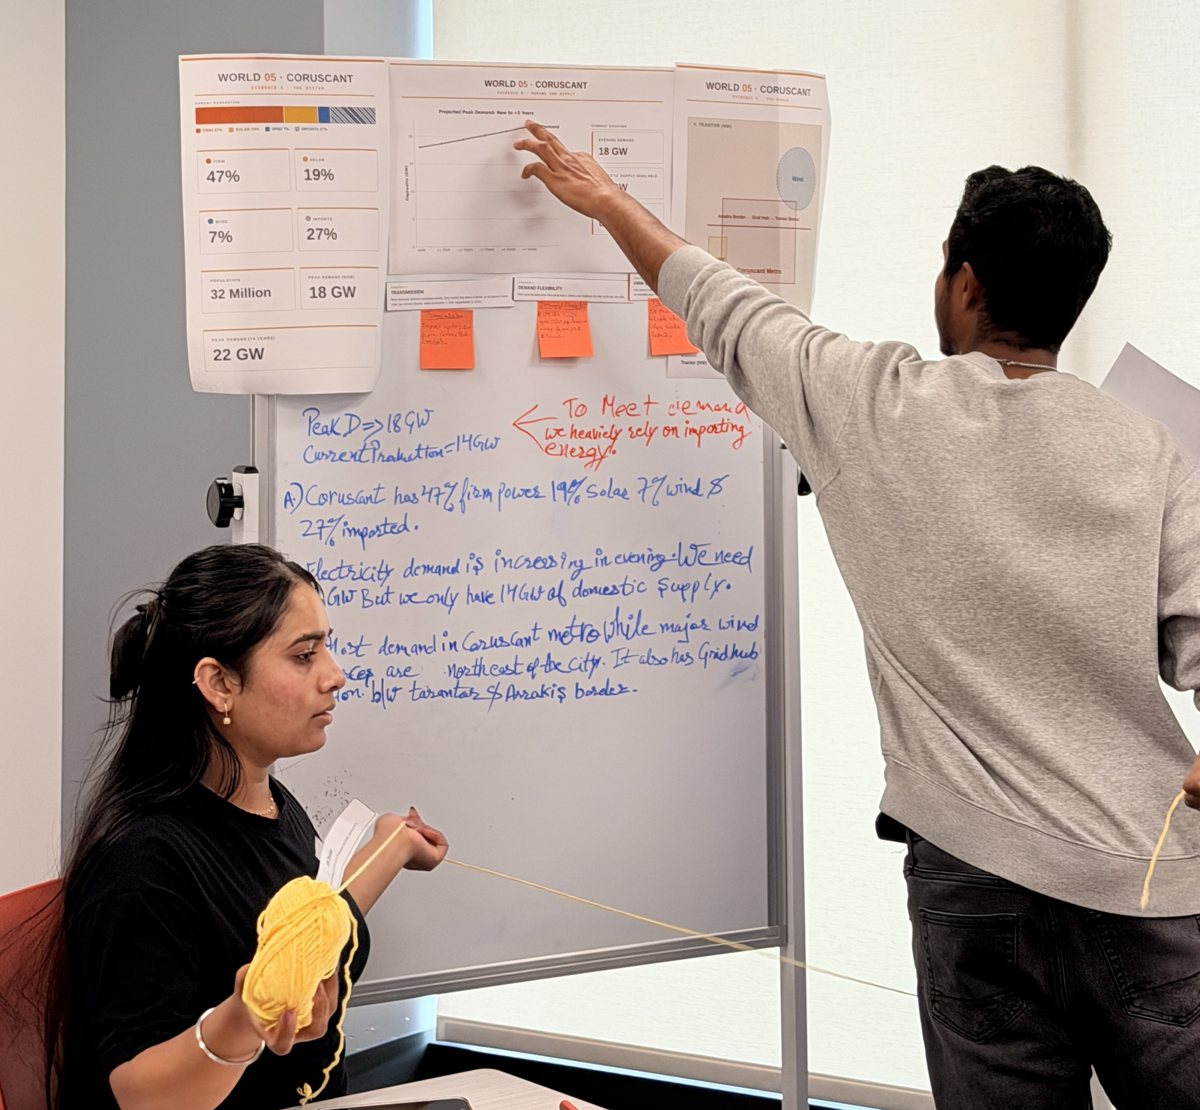
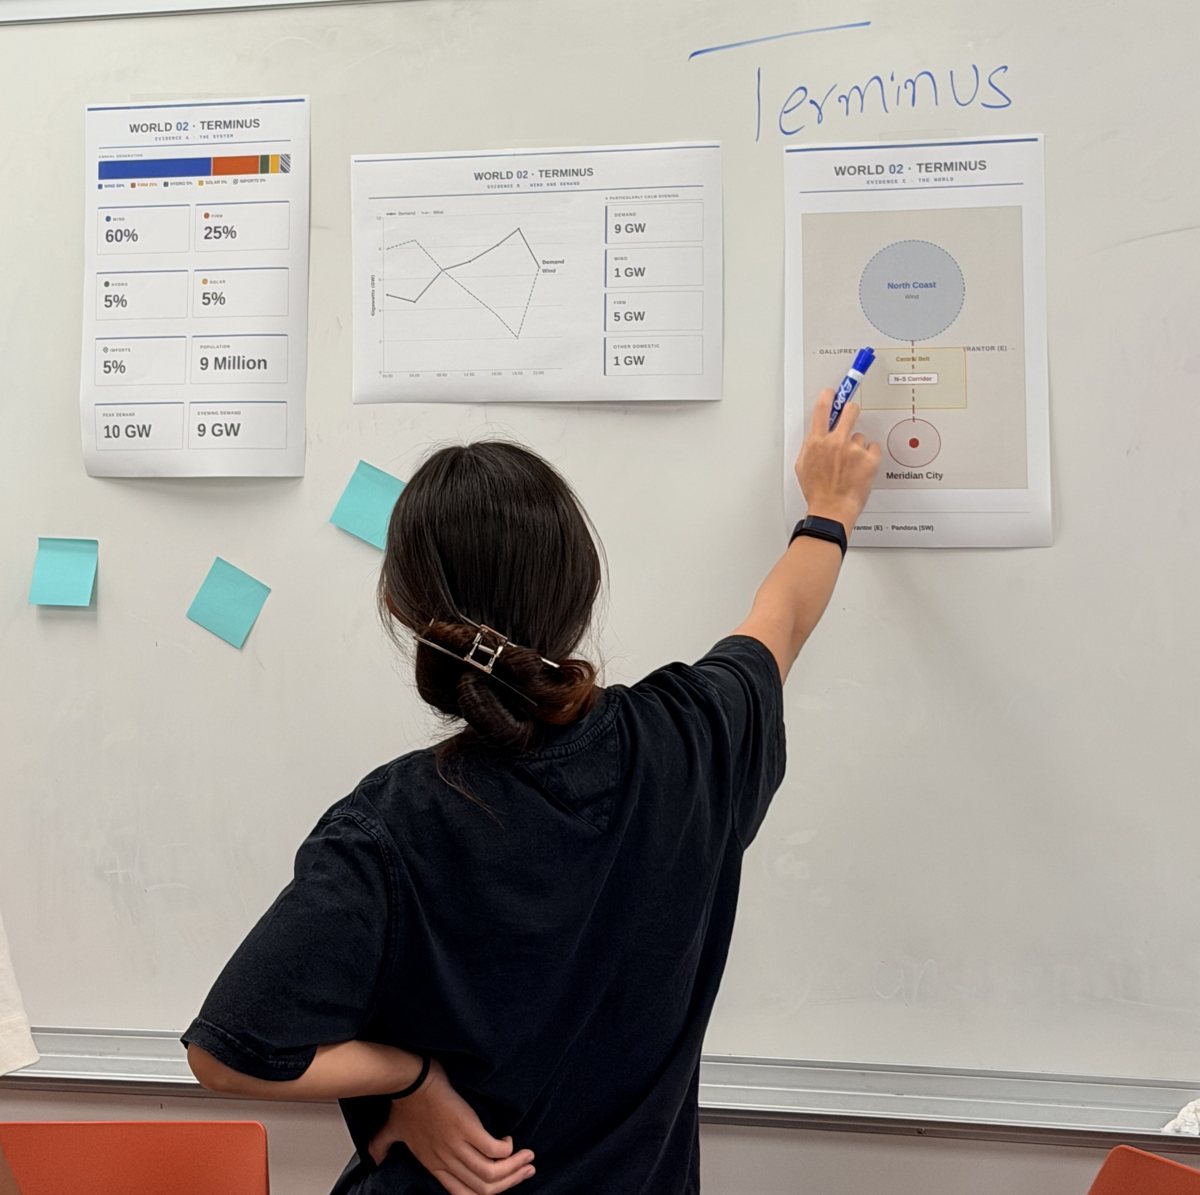
In Week 2, the class ran a power grid. Six teams each governed a fictional world, with its own energy mix, demand curve and map. The teams traded power with each other, and each trade was a strand of wool stretched across the room. Then a stress event hit, and every team had to decide what to do with the evidence on its board.
Drawing a Decision’s Chain
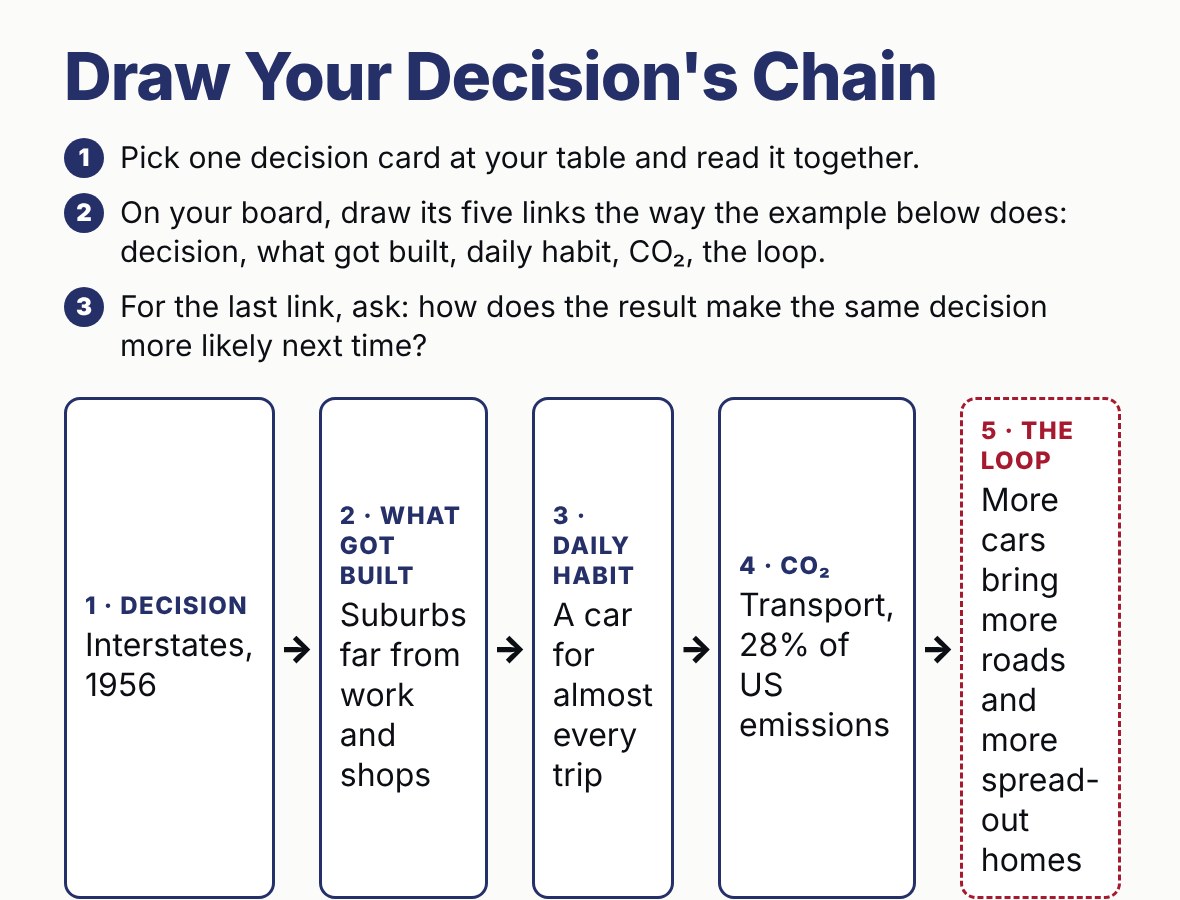
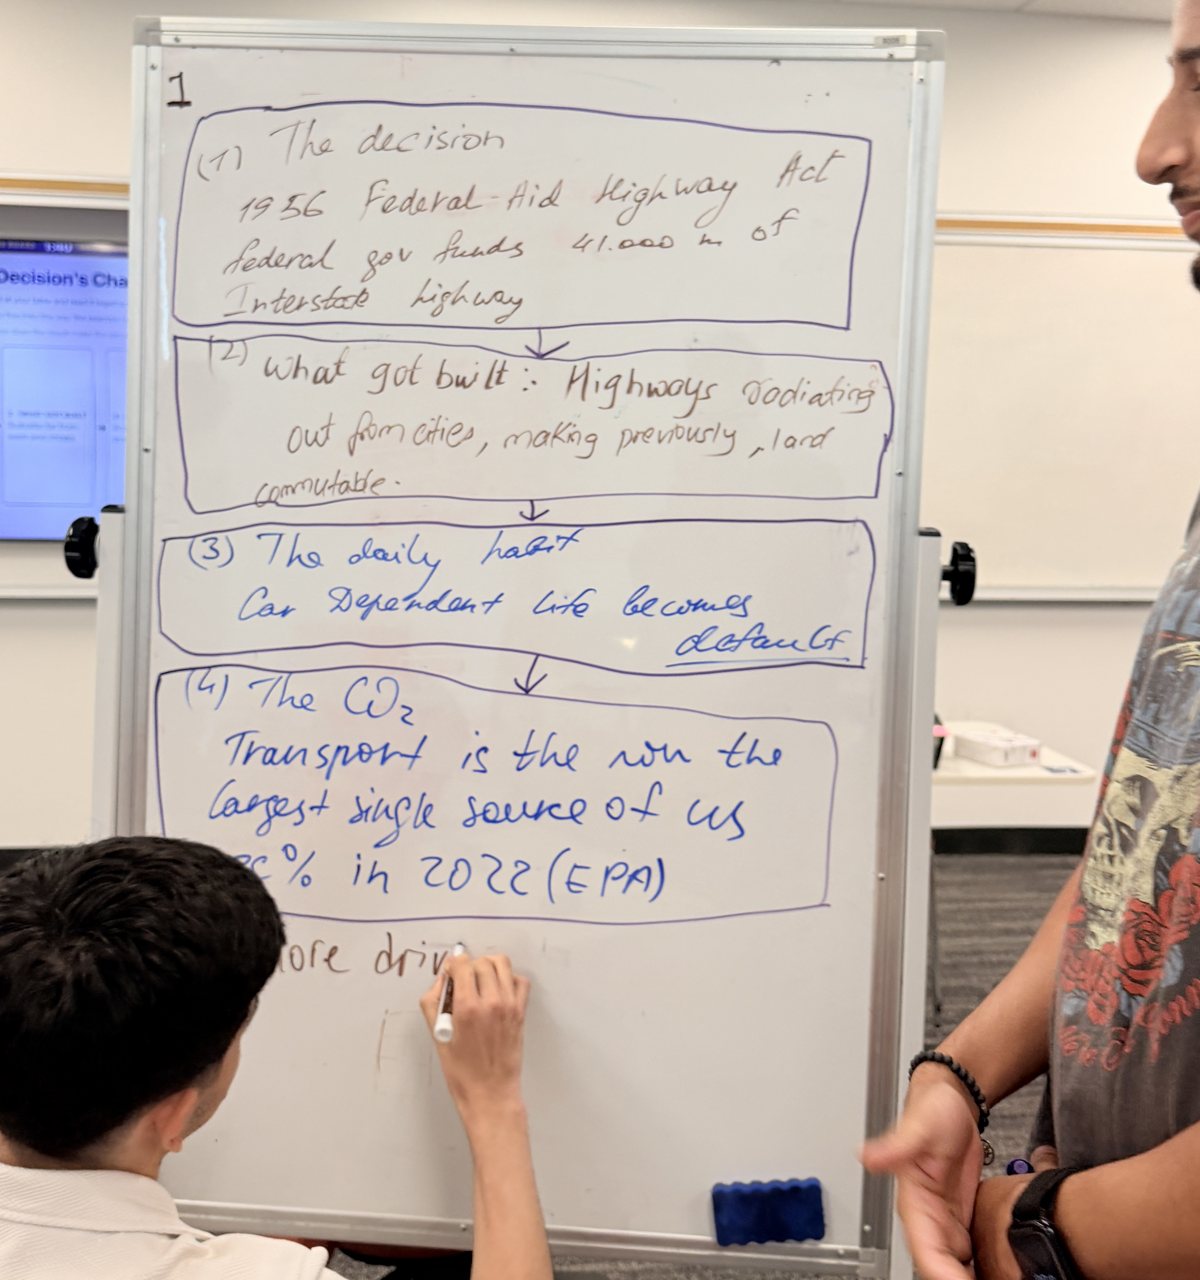
In Week 8, students asked why the United States emits so much carbon dioxide. Each table took one historical decision and drew its chain on a whiteboard. The first three links are the decision, what got built and the daily habit it created. The last two are the CO₂ that followed and the loop that makes the same decision more likely next time.
Same Data, Different Answers
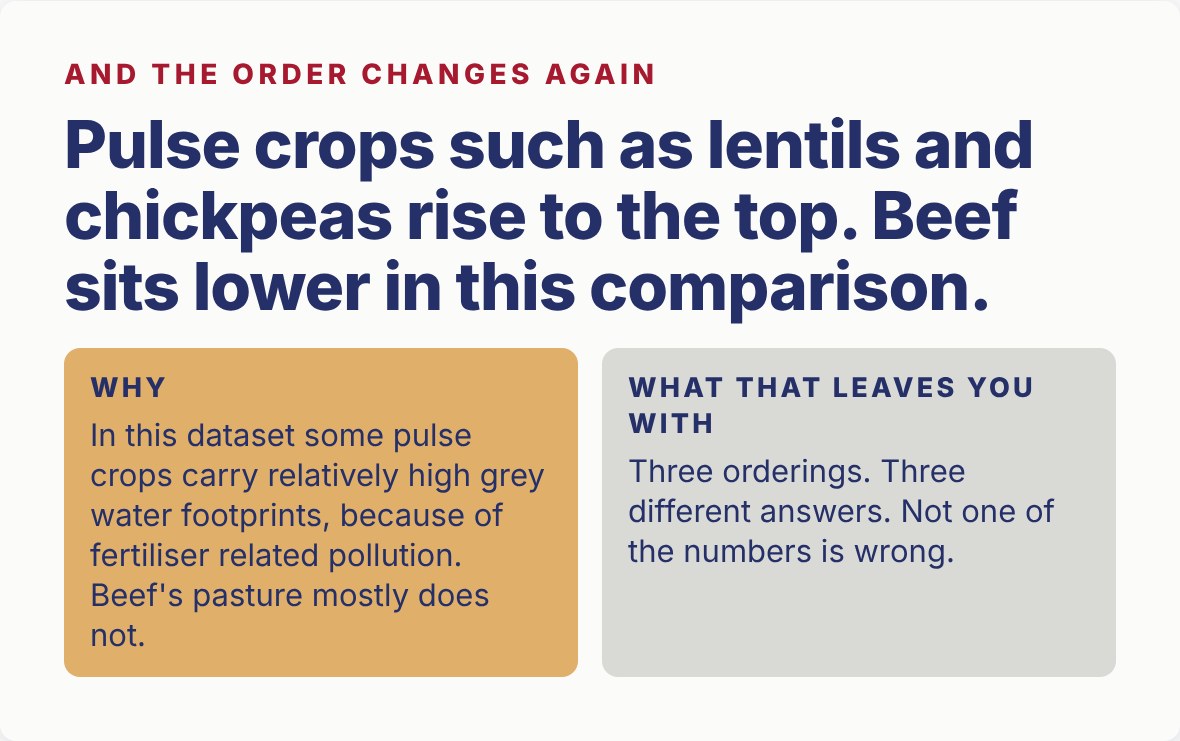
In Week 6, students put the dish their family cooks on a shared board. Then they sorted the board by water three times: by total water, by irrigation water and by the water needed to dilute pollution. The order changed each time, and none of the numbers was wrong. Students learned to ask which measure a ranking uses before they argue about the ranking.
I am writing the book for this course alongside it. If you would like to see a full deck, or talk about designing a course in this way, write to me.
Write to anzar.khaliq@sfbu.edu.